Trading the gaps at the open are one of the most used strategies by day traders. In this post, I will explain to you how and when I do this in the most simplest way I know.
Let’s start.
Gap ups and downs happen when there’s a news catalyst involved and released when the market is closed. Because of this catalyst, chances are there will be a sudden change in market sentiment which creates the said gaps upon market opens.
If the news is negative, it will open lower than it closed without any trading activity in between, hence the term gapping down.
If the news is positive, it will open higher than it closed without any trading activity in between, hence the term gapping up.
However, at most times, the market does not like gaps and these gaps are always filled by the market in just a matter of time. When the price action returns to the gap opening level, we say that the gap is filled.
How to Trade the Gap Opening?
Set the time frame to 1 min + 5 min combination. Mark the area of gap by placing a horizontal ray line. Now that you marked the gaps, wait for the market to open.
Gap Up
If the market gaps up – you need to wait for a sign of heavy sellers. You sell once you see a bearish breakout from any of these patterns:
Bear Flag
Double Top
Triple Top
Descending Triangle
Here’s an example of market gap ups getting filled.
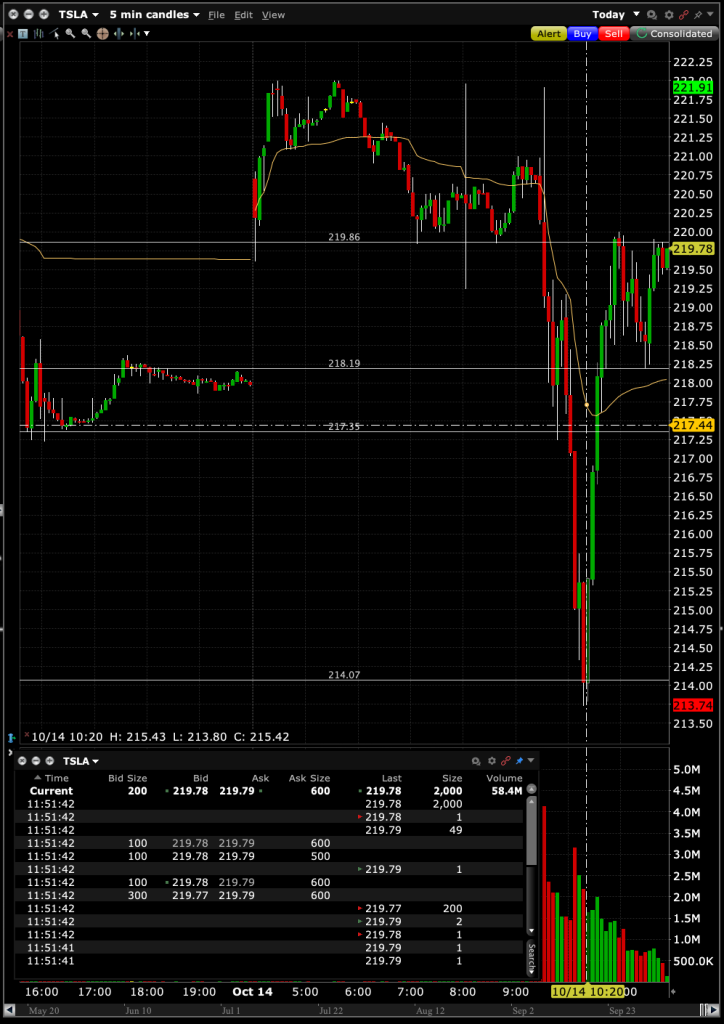
TSLA (Tesla) gapped up during the premarket trading on October 14, 2024 and since TSLA sold off around 9% last week, we will trade this to the downside but only once the heavy sellers come in upon breaking out the support at $219.86. It filled the gap at $218.39 plus giving up more all the way down to $213.74

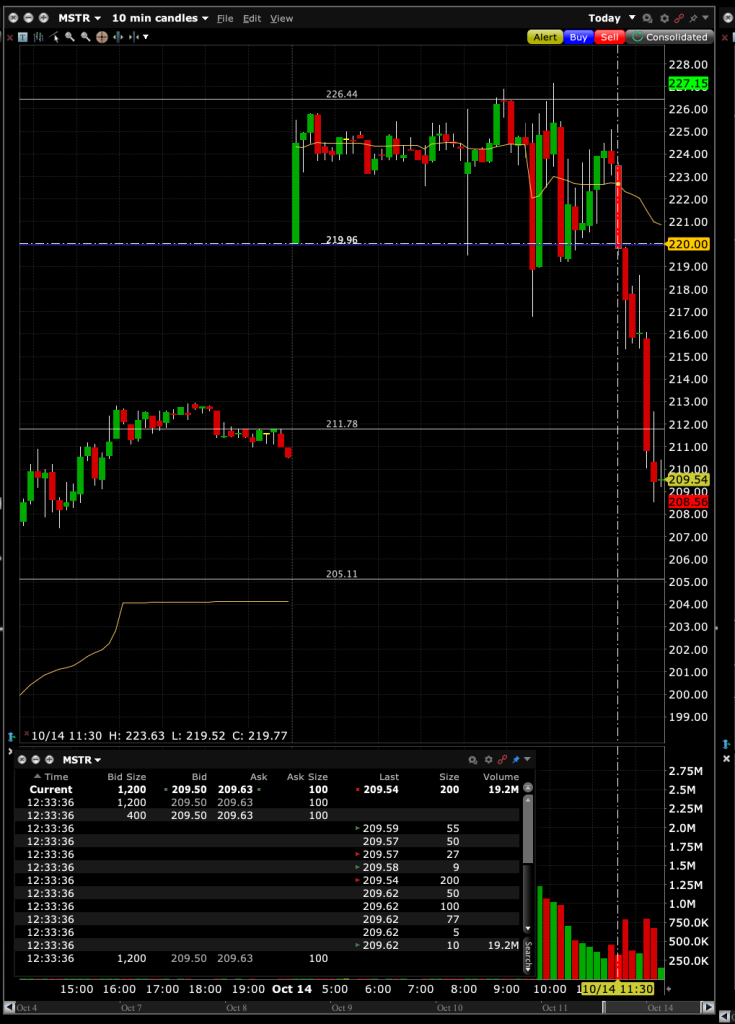
Another example is MSTR (MicroStrategy). MSTR was gapping up around 8 points as Bitcoin was trading at around $65k level on the early morning of October 14, 2024.

Notice how the pattern formed a rising wedge before giving up the $220 level allowing it to fill the gap at $212. This stock closed at $201.67.
Gap Down
If the market gap goes down – you need to wait for a sign of heavy buyers. You buy once you see a bullish breakout from any of these patterns:
Bull Flag
Double Bottom
Triple Bottom
Ascending Triangle
Here’s an example of market gap down getting filled:
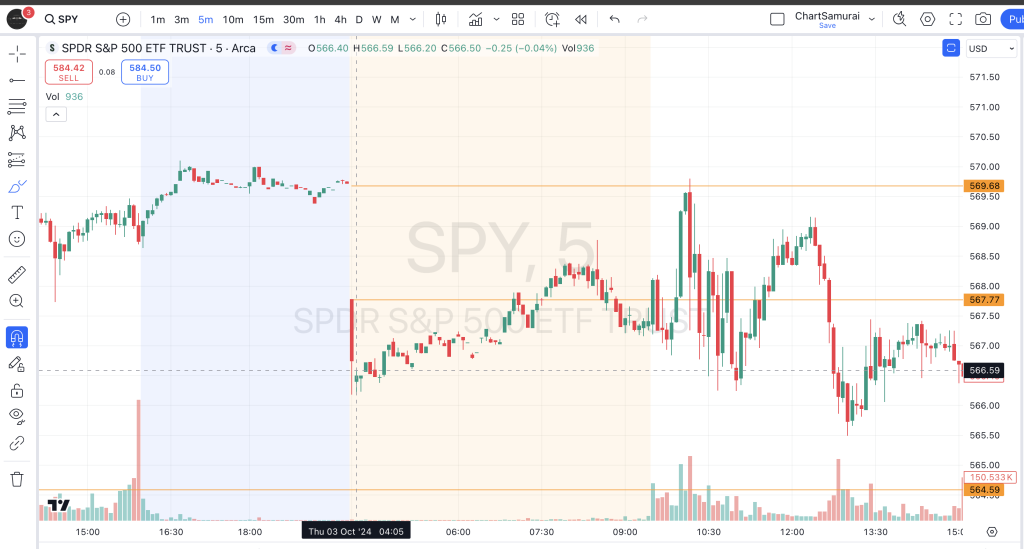
During the premarket of October 3, 2024, SPY gapped down from $569.68 to $566.59, but after the market opens, the gap down was filled at no time.

Though this is a highly probable trade of making money, there is no guarantee when the gap will be filled so proper risk management should always be at hand when the trade doesn’t work out.
For those who trades long call or put option contracts using this strategy, careful timing is important and the pattern set up should be visible accompanied by the volume of the said contracts. Avoid taking far OTM strike price when using this strategy as IV and Theta are the main enemies of the premium once the trade goes the opposite direction.